David Berges
Timbal vs LangGraph: What Tracing Costs an Agent

Around every model call, an agent framework does work: it validates inputs, dispatches tools, moves state between steps, collects outputs and records what happened. In a single-agent demo you never notice it. In a workflow with dozens of steps, it is part of what you run and part of what you have to understand.
Timbal puts agents, tools, workflows and tracing in one execution model. We wanted to know what that costs, and what it saves, next to LangGraph, a widely used framework for building agent graphs in Python. So we measured local execution overhead with tracing off and with LangSmith callbacks on.
On three agent loops, Timbal’s median execution time was 0.30 to 0.58 ms. LangGraph with LangSmith callbacks took 4.55 to 7.62 ms in the same run, a latency ratio of 10.5 to 15.1 times across the matching cases. Against bare LangGraph, repeated in fresh processes, the ratio was 4.9 to 6.0 times.
10.5–15.1×
lower median latency than LangGraph with LangSmith callbacks, on three synthetic agent loops
These figures measure framework and adapter overhead with synthetic models and tools. They are not a prediction for an application that spends most of its time waiting on a model, and the last sections say what they do and do not show. The architecture is worth looking at next to the timings, because it decides how an application is composed and how its execution can be inspected.
Tracing is part of the workload
When an agent returns an unexpected answer, you need the model calls, tool inputs, intermediate results, failures and timings that led to it. That is why we measure with tracing in the picture, not around it.
Timbal creates structured spans as its runnable components execute. A span can carry inputs, outputs, timing, status, errors and usage, and spans keep their parent-child relationships, so nested execution stays nested. Where traces are stored is configurable, and the benchmark uses the in-memory provider. Timbal tracing implementation.
LangGraph offers execution streams and, with a checkpointer, state history. LangSmith adds an integrated tracing and observability service. Comparing Timbal with LangGraph plus LangSmith therefore makes sense whenever instrumentation is a requirement of the application. See the LangGraph docs on streaming, checkpoint persistence and LangSmith tracing.
We report three configurations: Timbal with in-memory tracing, LangGraph without trace callbacks, and LangGraph with LangSmith callbacks. In the last one, a tracer subclass disables the persistence methods. It keeps the local callback bookkeeping and leaves out upload serialization, batching, network delivery and durable storage. The comparison measures local execution and instrumentation. It does not compare the hosted observability services.
An agent loop, three ways
The agent comparison uses LangChain’s current create_agent API running on LangGraph. Its predecessor, create_react_agent, is deprecated, so it is not the basis of any figure here. API migration.
All three scenarios use fake models and trivial arithmetic tools:
A single-tool loop makes two model calls around one tool invocation.
A three-tool chain makes four model calls, with add, multiply and subtract run in sequence.
A parallel-tool loop requests add, multiply and negate together, then makes a final model call.
The first chart shows p50 execution latency from one full run, with 100 timed invocations per configuration and workload. Lower is better.

LangSmith export was disabled. Relative to Timbal, the recorded values work out to roughly 15.1, 13.1 and 10.5 times. Full output.
Turning on the local LangSmith callbacks added 2.56 ms to LangGraph’s p50 for the single-tool loop, 4.07 ms for the three-tool chain and 2.82 ms for parallel tools. Those are differences between configuration medians in this run, and they leave out remote export and storage.
A single run can mislead, so we also repeated the bare-LangGraph comparison in three fresh processes. Taking the median of the process medians, Timbal measured 0.273, 0.593 and 0.542 ms, and LangGraph measured 1.636, 3.511 and 2.632 ms. That is 6.00, 5.92 and 4.86 times. The repeats are a separate dataset, so their Timbal values are not used in the traced ratios above. Repeat methodology and results.
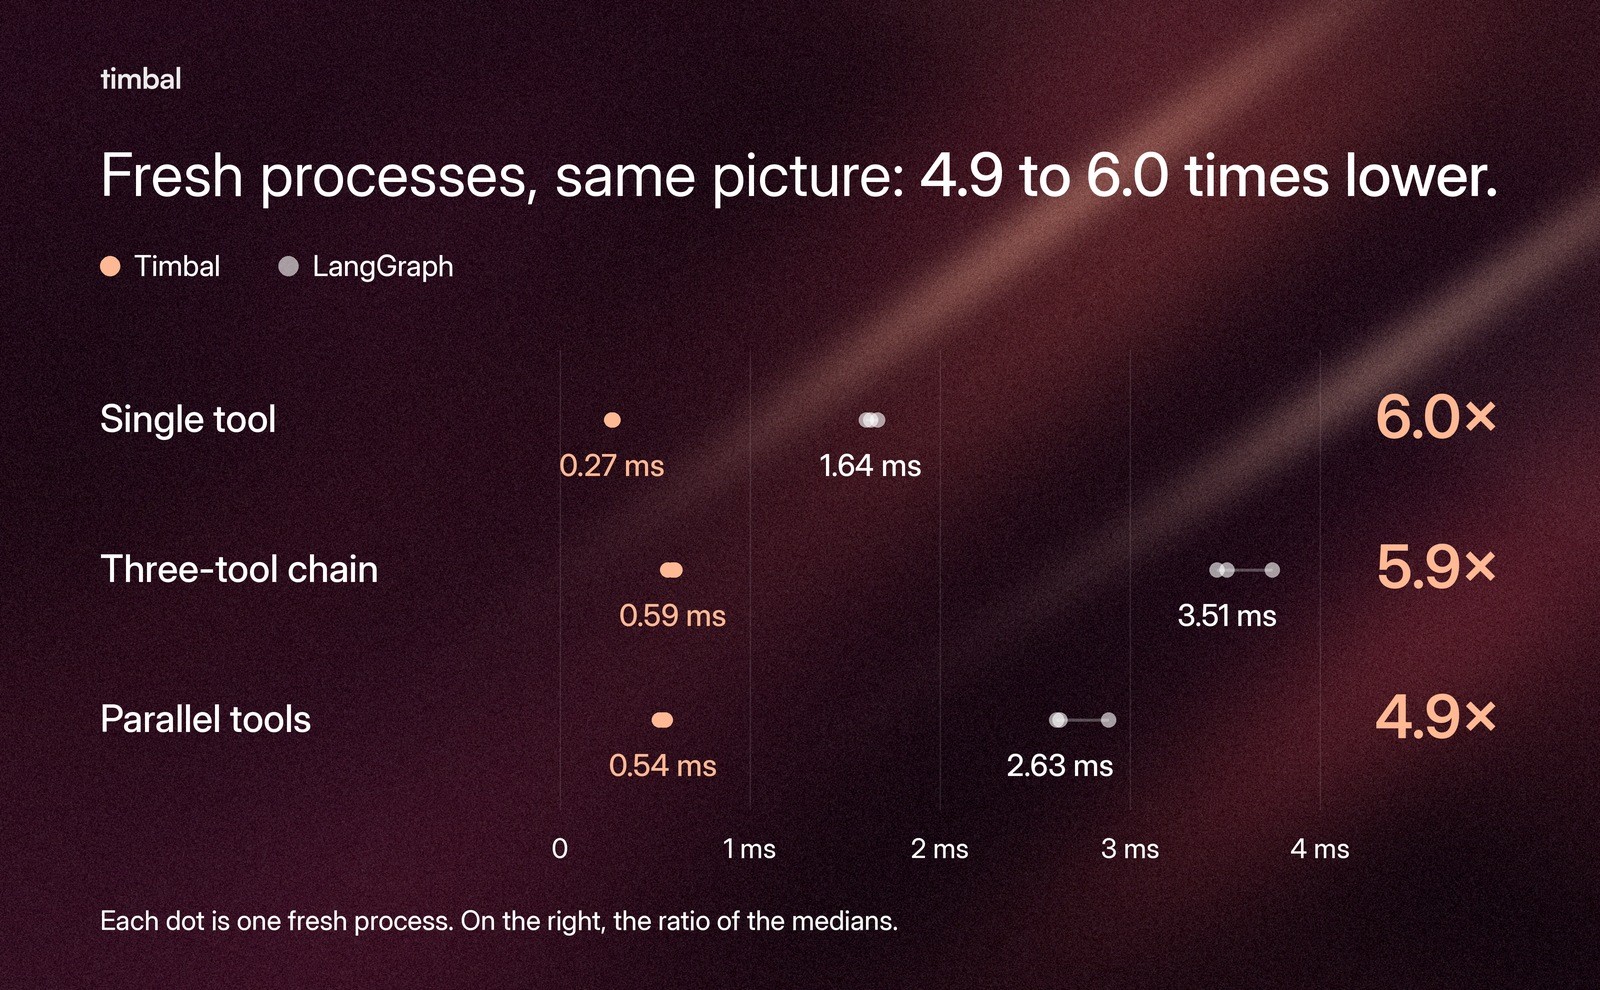
In the repeated bare comparison, that is roughly 1.4 to 2.9 ms saved per invocation. What it means for your application depends on how much of its time goes to models and tools. A synthetic workload isolates the overhead that a slower model response would otherwise hide.
Under load
The throughput test times the completion of a batch of 200 agent loops at concurrency limits of 1, 10 and 50. The figure shows the limit of 50, and the order of the three configurations is the same at 1 and at 10. These are single-run results for a synthetic workload. They describe framework throughput, not production model-serving capacity.

At a limit of 50, Timbal completed about 4 times as many loops per second as bare LangGraph and about 10 times as many as LangGraph with callbacks, across the three workloads. Those ratios are computed from the recorded values.
Bigger graphs
The comparison also covers deterministic workflows, with the same three configurations. The first set is three small shapes with trivial synchronous steps: a sequential chain, a fan-out/fan-in graph and a diamond. They measured 0.422, 0.560 and 0.525 ms for Timbal, against 1.40, 1.47 and 1.46 ms for bare LangGraph. Small-graph results.
The second widens a graph from 4 to 64 parallel branches between one root and one sink. Branches are asynchronous with no artificial sleep, so the numbers emphasize scheduling and local instrumentation. At 64 branches, median latency was 3.56 ms for Timbal, 6.05 ms for bare LangGraph and 21.4 ms with LangSmith callbacks. Parallel-branch results.
The third adds a second fan-out after an aggregator. With N branches in each phase, one invocation runs 2N + 3 steps, which is 259 in the largest case, with the same asynchronous, zero-sleep branches. At 259 steps the p50s were 14.3 ms, 29.5 ms and 90.0 ms. Double-fan-out results.
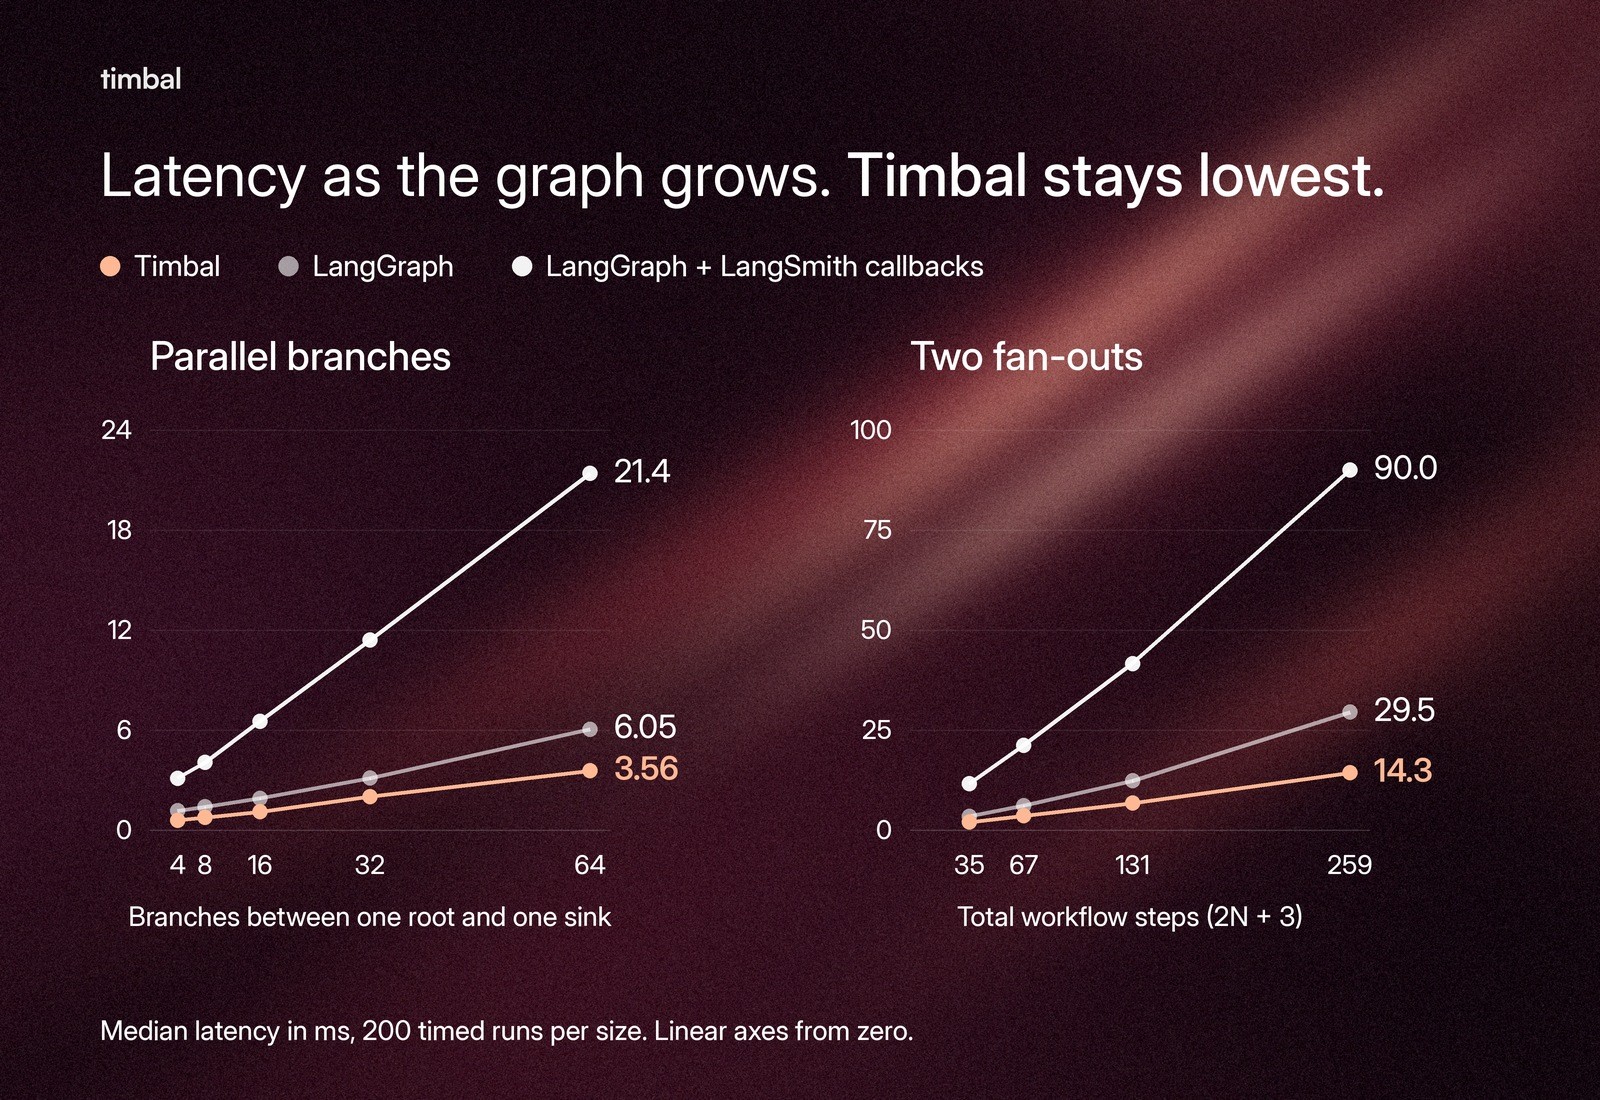
All of these are single full runs with 200 timed invocations per graph shape or size, and graph construction is excluded.
One execution contract for agents, tools and workflows
Timbal’s Agent, Tool and Workflow share the Runnable base, so input validation, event streaming, output collection and tracing follow the same contract everywhere. A plain Python function can become a workflow step, an agent can occupy another step, and the resulting workflow can be handed to another agent as a tool. Runnable implementation.
Here is a pipeline that normalizes a document and passes it to a summarizing agent. The model identifier and credentials should match your provider setup.

The reference to the output of normalize is what sets the dependency between the two steps. The workflow exposes the unbound text input, and inside an async function you call it directly with result = await pipeline(text=document).collect(). The same workflow can also go to an agent as a tool: Agent(name="assistant", model="openai/gpt-5-mini", tools=[pipeline]).
When the assistant calls that tool, the trace keeps the nesting: the assistant, the document workflow, its normalization step, and the summarizing agent with its model call. Changing the composition does not mean adding tracing callbacks to each function. Composition documentation.

That is a concrete kind of simplicity: the same execution contract stays useful as the application grows. You still have to understand Timbal’s run context and output references, and dependencies that cannot be inferred are declared with depends_on.
LangGraph makes a different trade. Its Graph API makes state schemas, nodes, edges and state-update reducers explicit, which is valuable when shared state is central to the workflow. Its Functional API also supports ordinary Python control flow through @entrypoint and @task without the same explicit state declarations. A fair simplicity comparison uses the API that fits the application. LangGraph Functional API.
Conditions, and how to reproduce
The measurements were recorded on October 24, 2026, on an Apple M1 Pro with 10 logical CPUs and 16 GiB of RAM, running macOS 26.5 and CPython 3.11.11. Timbal was at commit 4e3dc4a6. The comparison used LangGraph 1.2.17, langgraph-prebuilt 1.1.1, langgraph-checkpoint 4.3.0, langgraph-sdk 0.4.9, LangChain 1.4.7, langchain-core 1.7.0 and LangSmith 0.14.12.
Agents and graphs were built once and reused, and construction and compilation are excluded from the timings. The full agent run used 10 warmups and 100 timed invocations per configuration. The repeated bare comparison used three processes, each with 10 warmups, 200 Timbal samples and 100 samples per LangGraph API.
The setup has limits that belong with the result. The agent tools are synchronous arithmetic functions. Timbal runs such cheap handlers inline by default, while LangChain’s synchronous StructuredTool invocation uses an executor when called asynchronously. The measurements include that scheduling difference and the different fake-model adapters of each framework. Framework order within each script was fixed, and everything ran on an ordinary laptop.
The harness isolates each independent Timbal run and checks expected agent behavior before measuring. Older outputs, taken with different context isolation and tracer mocking, are excluded. We do not use batch peak memory divided by invocation count as a per-request allocation metric, and we do not use burst timing for any application-latency claim.
The benchmark directory has the pinned requirements and commands, and the comparison report links the corrected raw outputs, repeat samples and environment metadata.
Choosing an execution model
Timbal combines composable agents and workflows with tracing in one runtime. In these synthetic workloads, that runtime finished agent loops with much less local overhead than the LangGraph configurations we tested, including LangGraph with LangSmith callbacks on.
You can read the source, and the benchmark inputs are small enough to change. Replace the synthetic tools with the work your application does, keep the tracing setup you need, and measure what you get. That is the comparison that matters for a real framework decision.


